
Our guest columnist of the week is David Stickland, a senior Research Phsyicist with Princeton University, who is based at CERN in Geneva, Switzerland, working on experiments as the analysis coordinator
for the L3 experiment at LEP and the computing coordinator for the CMS experiment at LHC. Stickland is also known as the official FEI score analyst and has set up the company Global Dressage Analystics, supported by Akiko Yamazaki and the World Dressage Masters, to provide riders statistical insight into their scores. Since 1990 Stickland calls himself "an un-impressive but keen" amateur rider and horse owner. Wife Lyn and daughters Rachel and Clarissa are very active dressage riders with their sights set on getting as far as possible in this discipline.
Global Dressage Analytics founder David Stickland talks about changing the way we make use of our scores
In the 2011 movie Moneyball actor Brad Pitt plays the manager of a major league baseball team who turns the club's fortunes around by using analytics to select his draft choices and choose his teams. Global Dressage Analytics (GDA) is planning to do the same thing for dressage; we took a new look at a rider's dressage scores and found ways to interpret them to directly and effectively improve one's scores.
Dressage as a discipline is built on breeding, rider skills and training, but dressage as a sport is based firmly on numbers. There is literally a wealth of information that can be mined from scores, such as the trends in an average score for a figure type, the variations in the scores obtained for a rider-horse combination, the breeding characteristics, the agreement and the disagreements between judges, front views and side views of various movements, etc. In this exciting Olympic year two of the major dressage nations have asked GDA to supply them detailed analysis of their potential teams and crucially to provide feedback on strengths and weaknesses that can be taken into account by riders and trainers in their preparations. "Moneydressage" instead of Moneyball.
In preparation of the 2010 World Equestrian Games Steffen Peters made use of the first versions of this analysis. Over the past two years GDA with the support of Dutch Sports foundation InnoSport has been quietly putting together a web-based app to make the same sort of feedback available to every rider of any level. The first users of this app are the German and Dutch Olympic Selectors, Trainers and Riders. The national pride, financial expenditure and sporting excellence invested into the discipline dictates that countries will want to use all of the tools available to optimize their team performances. Medals can be decided by tiny margins and you can give your team an additional edge by focusing each rider on the improvements most likely to yield score improvements.
Of course, it’s easy to say, “If I want 75% then I just have to get 7.5 in everything”! But real horses have different abilities; in reality the statement should be “I have to do as many things above 75% as I do below”, (And even that statement is only after taking account of the coefficient and number of repetitions associated to each figure type). Your score in any test is a combination of the raw abilities of the horse and the rider and their mastery of the exercise at a given level. Through statistical analysis of your scores you can visualize all these things and draw your own conclusions. If a movement score is low, then of course you would like to pull it up, but it could be more profitable for you to concentrate on those figures that are sometimes good, and sometimes not, the ones with the largest spread meaning you can perhaps more easily improve them. It can also be very useful to recognize all the things that are going well, and take encouragement from them!
For example, in Figure 1 you can see your performance over a period of time for 4 different figures.
Which ones should you work on now to improve your final score?
- The Extended Trot has the lowest note, but it also has the lowest spread and it is getting worse over time, maybe it's going to be a hard problem to fix?
- The Rein-back is getting better, has a lot of spread too, maybe you could pick up a few points there?
- Pirouettes are pretty good, but they have a lot of spread, sometimes good, sometimes not…
- And the zig zag, that is getting a little better, but there’s not much spread in the scores.
Don’t know which to concentrate on – maybe just do a bit of everything and hope for the best?
FIGURE 1: Different figure types with different influence on your final score AND with different susceptibility to improvement

Through statistical analysis you know exactly where you can gain the most points in your final score.
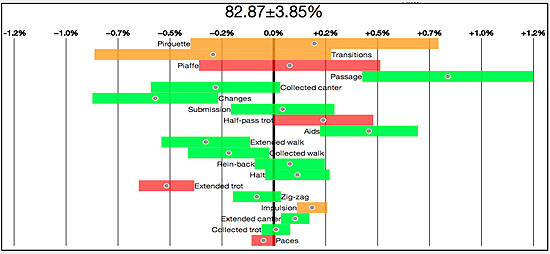
Since a love of statistics is not what got most people into dressage, the use of graphics helps to get the message across. So in this next figure we show our prediction for your next competition. The expected score is 82.87%, but there is a spread of 3.85% on that. For each figure type we plot on the graph how it contributes to this score, the dot at the center of the bar shows the average contribution, if it is above the center line then it is adding to your final score, if it is below, it is pulling you down. We use green to show figures that are getting better over time, red those getting worse, and orange those that are more or less the same. So this graphic shows you your strengths and weaknesses. Extended trots are pulling you down by 0.5%, Passages are pulling you up by 0.8%, etc.
FIGURE 2: How each figure type is pulling your final score up or down
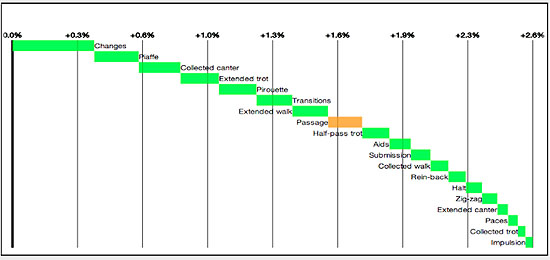
But this is only one aspect of your analysis, in the next figure we concentrate not on the score you received, but on the potential for improvement; how bringing each figure in turn up to your best performance would affect your final score. If you sometimes do much better than other times then clearly you have the potential to improve that figure, it just doesn’t come every time yet.
Now we see the big picture, While the Extended Trot is the figure that pulls you down the most; the potential for improvement in it is not so big. Based on the trend and the spread of scores you have for it, in the short term you can’t reasonably hope to pull your score up by more than about 0.15% by working on this figure. But the Pirouettes are offering you a potential improvement of 0.6%, you just need to perform more consistently at your best in them. It's a possibility for you! Of course you can and should work on the Trot too, because you want a better overall performance, but the points are more easily picked up in your pirouettes.
Figure 3. Improvement potential. For this horse the pirouettes yield the most easily achievable increase in final score, there are no quick improvements from the Extended Trot, Rein-Back or Zig-Zag. (But the Piaffe/Passage work has a big potential for you too)

In Figure 4 you see the same thing for another horse with quite different potentials for improvement. These are just a few of the views that GDA gives you, On the Global Dressage Analytics Website at http://dressageanalytics.com you can see the full range of tools available to a Rider or Trainer, soon to be complimented with similar, but differently focused, tools for Judges.
Quiz-time: which horse is being shown in Figures 1-3? (Not so hard….)
Figure 4. Improvement potential. For this different horse, the most accessible extra points are in the change-lines, the pirouettes offer less than half as much potential gain as the changes do.
Predicting the 2012 Olympic Team Result with Score Analysis!
With score analysis one can discover the team possibilities for the 2012 Olympic Games and make a prediction based on the current form of the combinations most likely to compete for 5 medal contending countries. By considering about a year's events for each of the candidate couples I made my selections and predictions of the Grand Prix and Grand Prix Special scores. Remember this year both events count for the Team medals! I used the data to predict not just the most likely final scores but also the uncertainty (spread) on them, so with this not only the final placing can be predicted but also the probability for a team to move up or down in that ranking.
Of course, at this stage the final teams are unknown, and a lot can happen between now and July, so I also take into account alternate team selections. The results for first team and second teams are shown in Figure 5 and they are perhaps surprising! Everyone expects that GBR will be a very strong Gold medal candidate if they field their top three combinations, but it turns out that the medal race opens up completely if any one of them can’t participate for any reason.
Figure 5. GDA Olympic Predictions 16/1/2012
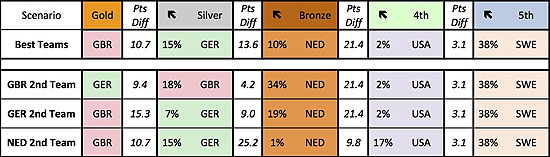
The top row in the table shows the prediction if all 5 nations field what I currently consider to be their top team. What is shown is the medal assignment, the difference in team score between one place and the one below it (the winning score is predicted to be about 480 points) and the probability (e.g. 15%) that a team in one position can move up by one rank (the column with the arrow). The other rows show what could happen if one country at a time had to field their second best team.
As every dressage person knows, Great Britain is the strong favorite for gold, but any injury to any of their top horses can completely change that, Germany has a lot of depth and so they are ready to take advantage of any British failing, and Holland while sitting in third position today has a strong possibility (typically 30-40%) to take advantage of any GBR problem and jump to the Silver position. What about the USA and Sweden? They are locked in a very tight battle for 4th and 5th place, only the tiniest margins are separating them, and if Holland would lose one of its top riders, then the USA and Sweden will be nipping at their heels ready to take that Bronze medal.
Of course, a lot can change in six months, we know that there are strong horses being prepared some of whom have not yet competed at this level, so today we can’t know how important they may be in the final results. Plus of course, with the 3-horse rule in place in 2012, any elimination or serious problem in the Grand Prix or Special for the top three nations drops them completely out of the medal chances. As the saying goes: “It ain’t over till the fat lady sings!”
Will the Olympics turn out as I predict? Well the numbers are published here and you can tell for yourself afterwards! In the meantime teams making use of score analysis have a suite of tools available to pinpoint where the gains and losses might be made and tune their performance optimally. And for the rest of us, those who may not be competing in London, GDA wil soon be available for national riders so they can star in their own Moneydressage blockbuster soon!
- by David Stickland for Eurodressage.com
Related Links
Biased and Nationalistic Judging Patterns Detected
In the Firing Line: The Dressage System of Judging
On the Road to an Increased Use of Half Marks